Simulate Early, Simulate Often... In Rhino
Use Scan&Solve Pro to quickly assess if you can switch to composites [bike frame analysis]
Intro:
Cycling is a sport that requires minimum skill. Because of this, the most elite riders need to be able to separate themselves from the pack in some way. They do this with nearly inhuman levels of strength and endurance. However, looking in those elite groups, those levels of strength and endurance are laughably common. So the same question arises: how does one separate themselves from the group? In general, cyclists know that the less weight they have to worry about, the faster they will be able to race. Because of this, over time, cyclists and manufacturers have increasingly turned to the bike.
With the development of composite materials, traditionally used materials such as aluminum can be replaced by carbon fibers composites. Such composites usually have higher stiffness to weight ratio, resulting in bikes which are considerably lighter. The objective of this project is show that composites indeed can be used to make lighter bikes, while keep the performance same as that of the aluminum bikes.
Problem:
In order to demonstrate that it is worthwhile to replace aluminum with composite, I am just considering a bike frame for the time being. I am assuming a load to the seat for a 200 lb. rider. This is a high estimate, however it accounts for variability and allows nonprofessional riders to use it as well. I fixed the head tube and the drop-outs where the wheels would be in contact and applied a pressure to the inside of the seat tube. The most important aspect of this design was the materials used in the modeling of the bike:
Case 1- carbon/epoxy composite + aluminum
Case 2- only aluminum.
Fig 1: loads/restraints of bike frame Fig 2: composite bicycle
As a brief aside, orthotropic materials are materials that react differently to the same stress applied in different directions. An easy example is wood. The reason that you see rings when you cut down a tree is that the grain of the wood is stronger in compression. If the rings were sideways, the tree would collapse. Hence, a load along the height of the tree is handled better than a load applied towards the center from the side of the tree. One of the advantages to Scan and Solve is its ease of use in applying orthotropic materials.
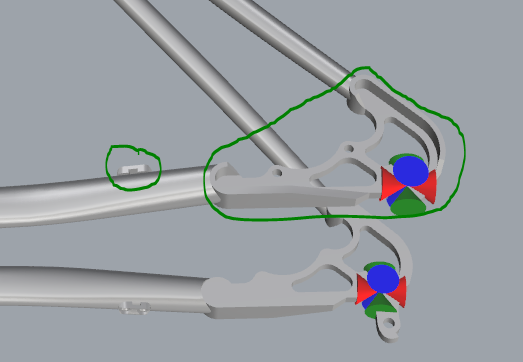
Now, let us return to the application of the orthotropic materials. When I created the model, I made sure to keep a guide curve and a surface to use in the SnS call. I made everything in the frame uniaxial carbon/epoxy composite except for the back stays and the wire holders. Those components were aluminum. Both features are in green loops in Fig 3. For specifics on applying orthotropic materials in SnS, use this link.
Fig 3: Back stay and wire holder
In Fig 2, you can see the composite pattern appears to wrap around the bike frame. In SnS, this is done by specifying guide curves and surfaces. For example, in this model, the guide curve went through the middle of the tubes in the model bike and the guide curve was the inner surface of the tubes.
Results:
Displacement:
Fig 4 - Carbon/epoxy (max = .0319 cm) Fig 5 - deflection scaled by 150x:


Fig 6 - Aluminum (max = .0215 cm):

Looking at Figures 4-6, you can see where the greatest deflections occur. The composite bike showed a max deflection of around 3 mm while the aluminum bike had a max deflection of about 2 mm. They main worries with deflections are the seat tube and the supporting tubes on the bottom. As the load increases, the rear tubes will begin to buckle in, which may seem counterintuitive.
Stresses:
Fig 7 - Carbon/epoxy: Fig 8 - Aluminum:
Next, we look at the stresses. There are a few points to note in figures 7 and 8. Two regions of particularly high stress are near the fixed points, which is expected. Because this was a global analysis, we are able to ignore high stresses near the restraints.
Figure 9 shows the plot of tension and compression stresses, and we can see which tubes experience which types of forces. This image also confirms the deflection field in figure 5. The outside of the back tube is blue (compression) and the inside is red (tension). This would indicate that there would be a deflection of the tube inwards or towards the center of the bike, which is confirmed in figure 5.
Fig 9 - Tension/Compression (carbon/epoxy):

Performance Comparison:
Comparing the deflections between the two cases, you can see that the max deflection is about 1.5 times higher for the carbon/epoxy when compared to the aluminum. Additionally, the deflection field is different. To understand this, I looked at the properties of both the materials:
|
Young’s modulus (longitudinal) E1 |
Young’s modulus (90 degrees off axis) E2,E3 |
XZ shear modulus |
carbon/epoxy |
1.34x10^11 Pa |
7.0x10^9 Pa |
4.2x10^9 Pa |
aluminum |
6.9x10^10 Pa |
6.9x10^10 Pa |
2.6x10^10 Pa |
As you can see, the composite material is almost twice as much stiffer in the longitudinal direction, but it is substantially weaker in the transverse direction when compared to aluminum. So, the composite frame should have higher deflection in the transverse direction. Indeed, when I looked at the strain in xz direction, I found substantial shear strain in the composite frame but not in the aluminum.
Strain xz:
Fig 10 - Carbon/epoxy: Fig 11 - Aluminum:
This confirms that the reason for the added deflection in composites was due to a large increase in transverse strains. However, the deflections are still small and comparable to that of the aluminum frame. The advantage of using composite shows up when the weight of the two bike frames are compared. The density of carbon/epoxy composite I considered is 1530 kg/m^3, while the density of aluminum is 2700 kg/m^3. Multiplying by volume (0.000 569 1 m^3) yields a mass of .87 kg for the carbon/epoxy bike and 1.54 kg for the aluminum bike. So using composite can cut the weight almost in half. This would be an excellent trade for one millimeter of added deflection.
Why Scan&Solve?
Scan and solve was particularly adept for the task at hand due to several features. I wanted a quick estimate of how much weight I can save by using composite. If you look at the model, there are multiple features in the bike frame that can be a headache to solve in mesh based FEA programs. Note, in particular, the details in the back stays along with mounts for the wires and the holes in the frame. Another difficult region to mesh would be be the thread where the pedals are mounted. So, even just to get a quick estimate, I might have to spend hours meshing or removing those small features and details that cannot be meshed easily.
Fig 12 - holes: Fig 13 - wire mounts:
Fig 14 - back stays: Fig 15 - thread:
Scan&Solve, however, uses a meshfree method, so it does not need require defeaturing. For a quick estimate, I was able to use coarse resolution that automatically ignored the small features and details. Together with the easy application of multiple materials and efficient way of specifying orthotropic materials, I was able to complete the simulation in no time.
Views: 1764
Comment


© 2024 Created by Michael Freytag.
Powered by
![]()
You need to be a member of Scan-and-Solve for Rhino to add comments!
Join Scan-and-Solve for Rhino